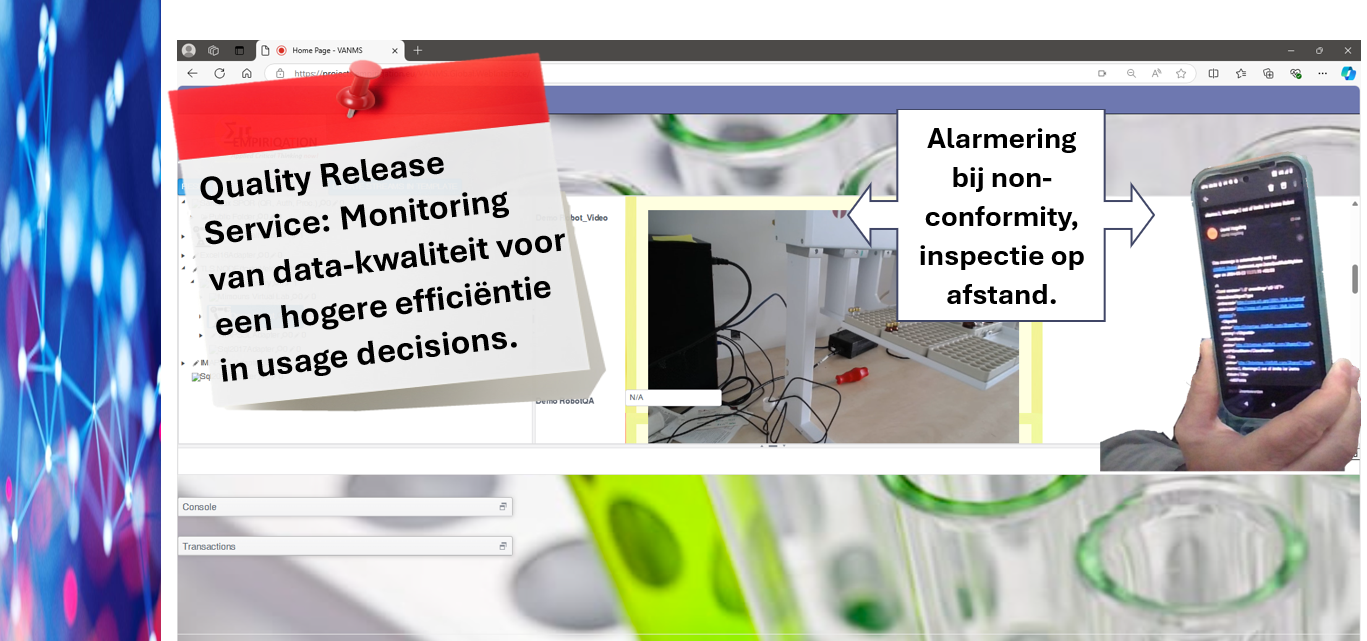
When do you need the service of Quality Release Support:
- If the teams associated with Usage Decision making (Quality control, R&D Lab, Operations) need an improved daily work-experience;
- Or, when critical thinking, integrity-by-design or continual improvement (GAMP5®) should become the heart of policies in manufacturing tasks and delays must be minimized;
- Or, when key-performance-indicators in you business processes need to become more functional and based on live content data;
- Also: to reduce rework and scrap of high quality grade goods and delays of orders on incidents, by a supplier of support who helps with solving the delays in usage decision making. For example by committing to a validated fallback data correction operation after a system incident (based on 20+ years of experience);
- To implement an enterprise standard based on proven technology (>10 years of success, for example for European Product Passport) or rather a light-weight step-up solution that can be scaled-up internally.
In this demo implementation case, each point summarized above is described with some background and with a focus on parts of the demonstration including a few technical details.
Content versus process

Conceptual background
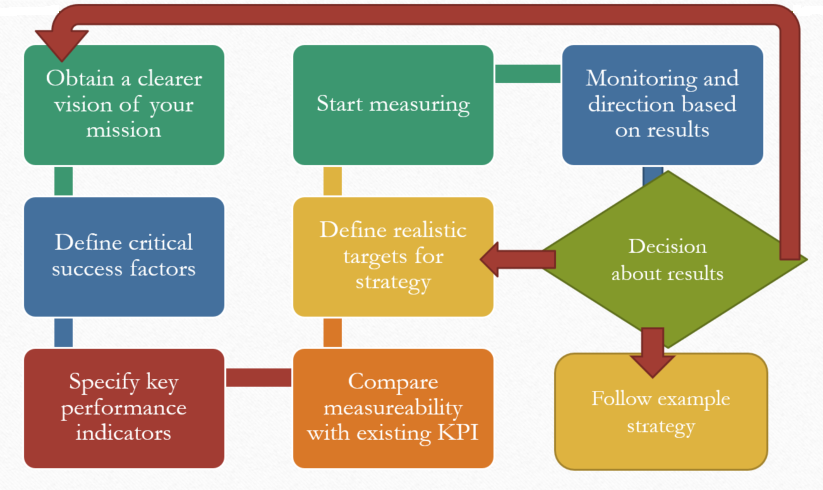
In this article, the background of the term Key Performance Indicator is combined with the GAMP5 QM Task-cycle of continual improvement. The workflow of balanced scorecards is displayed below. The QM Task-cycle has to be searched through the following hyperlink: GAMP5 IBD
Step-up of monitoring for integrity by design
Critical thinking, integrity-by-design or continual improvement (GAMP5®) should become the heart of policies in manufacturing tasks to solve the root-cause of delays. It’s a clincher saying that producing large quantities on time for a customer makes no sense if the quality isn’t conform the customers expectations. Delays in order delivery are often caused by quality issues. For example: production lines are blocked (this falls under process conformity), materials delivered with wrong packaging (raw material conformity), weather conditions like ozone or humidity (internal climate falls under process conformity) etc.
The step-up demo-solution is developed based on the continual improvement principle and the framework matches this principle well:
- The integrity-by-design foundation of GAMP5® is oriented around nine main data-quality characteristics throughout the lifecycle of a business process. These nine characteristics are the center of the step-up demo solution. This ensures that the implementation of the step-up solution follows the QM task of continual improvement.
- During the software development and installation of the demo solution there are 5 of these nine characteristics applied based on the first fully completed task-cycle :
- Attributability: in the development method of the software, Spec-By-Example/test-first is used. The attributability characteristic is quantified to a percentage such that unit-testing alarms on internal datamodel errors; The datamodel used is self-descriptive and one testscenario with multiple cases guarantee that the datamodel keeps contributing to the foundation of quality management.
- Quantified: 100% is conform, below 100 means there are non-contributing data elements detected;
- Archivability: a key element in each lifecycle of a business-entity is the sub-final state of archiving (final state is destruction). The solution is built with a test-spec to guarantee the support of this sub-final state of entities. The state of destruction is in the current version not covered automatically (assumed a low priority).
- Quantified: 100% is conform, above 100% is archived too soon (before the stage in the lifecycle is reached) below 100% is archived too late (stage in the lifecycle is reached) or unable to archive.
- Accuracy: based on personal experience this was the most often occurring case, so in the unit-testing this example case is worked out using a fictional equipment with values and calibrations. By running the test-cases on each build, a passing test demonstrates that the software stays fit for aggregation, warning and alarm handling.
- Quantified as: 100% calibration is due; warning on <100% for calibration overdue; alarm when a result is found on equipment with calibration overdue;
- On-demand/On-line: upon application of the demo the most critical quality characteristic was found as equipment not being on-demand at the moment it was needed. To cover this requirement a video stream was introduced and to allow remote inspection of moving parts of the equipment. When the video is outdated, an alarm is sent to indicate that the remote inspection is blocked (not on-demand).
- Consistency: another important characteristic found in the field was the number of errors in the use of the equipment, which leads to missing measurements (inconsistent results). This was quantified by counting errors in the equipment log. 100% is error free <100% sends an alarm for intervention.
- Attributability: in the development method of the software, Spec-By-Example/test-first is used. The attributability characteristic is quantified to a percentage such that unit-testing alarms on internal datamodel errors; The datamodel used is self-descriptive and one testscenario with multiple cases guarantee that the datamodel keeps contributing to the foundation of quality management.
Remaining 4,5 characteristics
The 5 characteristics above demonstrate how the model works. Throughout the visits the demo can be extended for at least the remaining characteristics of the full lifecycle: legibility (can be complex to verify if dates and numbers are correct and if access is granted where there is a need to know and no access is granted for roles without a need to know), contemporaneousness (measurement should be exactly traceable to the process based on the sampling-date), completeness (can be quantified by considering statistical completeness) and endurable (versioning of systems and warning on lifecycle risks when data is not archived while the system version reaches end-of-life).
Also one meta-characteristic is defined: qualified (is quantification of the characteristics free of errors) and three characteristics of distributed data are under construction (partly postponed to give prio to a visual demonstration scenario) – these three are: distributability, traceability and trackability.
Data-quality characteristics as functional KPI’s
Key-performance-indicators in business processes should be functional and based on live content data;
Key performance indicators have to be functional in order to visualize success-factors in a quantified way. First of all success factors are found in a task during operation (when the task is functioning, meaning: actively contributing to the mission of the business process) and then quantified and measured. Quantification and measurement of success factors in manufacturing operations (and logistics) traditionally involves technical IT systems such as LIMS, MES and ERP. Which of the indicators is found to be the most essential for quantification of the success of an operations depends on the content of the operation. Engineers or functional consultants are often the subject-matter experts on which indicator that is. The demo monitoring solution is based on live content data to work as a tool for continual improvement and to alarm on indicator-values that are not on target. Live data is optimal for good measurement and alarming, but obviously too much monitoring could impact performance as well, therefor aggregation is used for better analysis and evaluation.
Technical implications
There are many different technical systems based on vendor-specific claims that their data-model is a Industry 4.0 standard. These systems often have a data-integrity issue on the long term, meaning that the data is in a model that isn’t following the companies entities based on the daily work content. So after the system lifecycle, the data must be converted. A data-integrity monitoring solution already converts key characteristics of the entities in a data-scientific way. This as a benefit for reporting and backups/restores based on techniques that are built in on the most operating systems. The technical implication of our design means that the adapters work in an opposite way compared to the habits. Instead of storing the data in a standard way and representing it in a company-specific way, the monitoring tool works vice-versa. It reads data from any company-specific model and processes it through a standard data-integrity workflow and represents it in a living Internet-Of-Things hierarchy (things within things). This means a lot of XML conversion, single-ton services and load balancing mechanisms. The data is thereby easy to retrieve and easy to recognize and already archived for at least the quality characteristics.
Validated fallback operation
Rework and scrap of high quality grade goods, and delays of orders, can be reduced on incidents, by offering a clear report of the lots involved in an incident. When that report is based on qualified data it serves as a functional alternative for the standard usage decision.
As implementation partner and with 20+ years of experience in lab automation, access to the technical data model allows to setup a validated report as fallback of an automated system interface. Normally thousands of records are shared on one batch between the lab and ERP to indicate exactly which lot is good for shipment and which lot on a pallet must be blocked and reworked or scrapped. When a system incident occurs, sometimes the interface missed some of the lots while even one missing lot could block a complete order.
When everything is up-and-running the impacted order can be reported to bypass the interface. Such report should be well validated before being able to rely on it for usage decision making. Each usage decision has a slight risk on shipping a non-conform product to a customer and the standard operations guarantee that this is done in a risk-free manner. Upon incidents the standard operation doesn’t apply but by validation of an alternative operation this can be done risk-free as well. Knowledge of the data-model and quality data monitoring allows for validation of reports so that these reports are as reliable as a system interface.
In the demo, a report is used to show that the data-model behind the solution is a simple standard model to define reports in line with the used business entities. See also the article on linked-in “solving the traffic jam”.
Technical implications
The adapters read from live sources and keep an audit trail of data-quality characteristics. The installation and maintenance of these adapters implies at least read-access to the original data sources (equipment software, raw-data, LIMS, MES, ERP, WMS, …). The data is then aggregated and the audit data is protected following the company policies. The remote monitoring is a product of analysis and communication – which includes decision making what should and should-not be remotely available. This decision implies that certain aggregations become hidden for remote monitoring. Derived indicators can be found and a self-documenting application is under construction to allow down-drilling based on remote access or on-site access.
Conclusion
Implementation of a monitoring-solution is best done together with the QM-task cycle of continual improvement. The quantification of the 9 data-quality characteristics follows the balanced scorecard approach. The traditional technical bad-practices have to be addressed and replaced by data-driven techniques. Note that there are additional benefits not yet mentioned.
To implement enterprise standard based on proven technology (>10 years of success, for example for European Product Passport), we recommend the Orchestra® solution of Soffico. This solution has many useful features that can be setup as a template and rolled-out to follow real-time data. It is delivered with many adapters and can be applied both on-premise and cloud-based.
It is very well possible to start the QM-continual improvement cycles using the light-weight step-up solution to replace this later by Orchestra ® as an enterprise wide data-integration and integrity solution.